What is Product Analytics?
Learn how to leverage product analytics to understand behavioral data to deliver personalized experiences to your customers.

Craig Dennis
March 18, 2024
11 minutes
What do the largest and most successful companies have in common? They’re all worth billions of dollars and focus on delivering unmatched product experiences–experiences so seamless you forget you’re even paying them money. The key to building lasting digital products is ensuring users get value, which is only possible through product analytics.
In this article, you’ll learn:
- What is product analytics
- Why is product analytics important
- How to collect product analytics
- How to be successful with product analytics
- Product analytics vs. web analytics vs. campaign analytics
- Best product analytics tools
What is Product Analytics?
Product analytics is the process of collecting, measuring, and analyzing behavioral data to understand how users are interacting with your digital product so you can drive your users toward a specific goal and help them get maximum value out of your product.
The crux of product analytics starts by actually collecting behavioral data about your users via an event tracking tool. This can include anything from user logins, button clicks, and page views. Product analytics aims to help inform product decisions so you can optimize your digital product to enhance the user experience.
How to Collect Product Analytics
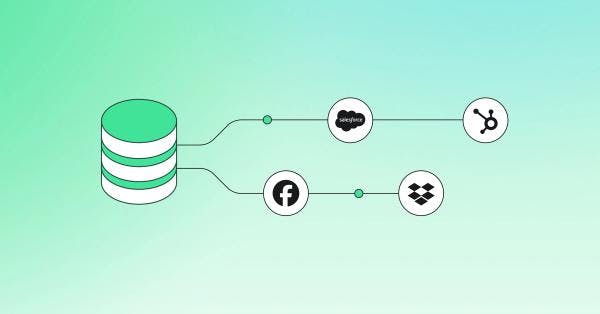
Before using product analytics to deliver better customer experiences, you need a way to capture product data. The standard solution here is to simply leverage an event tracking tool or deploy a software development kit (SDK) in your product so you can capture behavioral data.
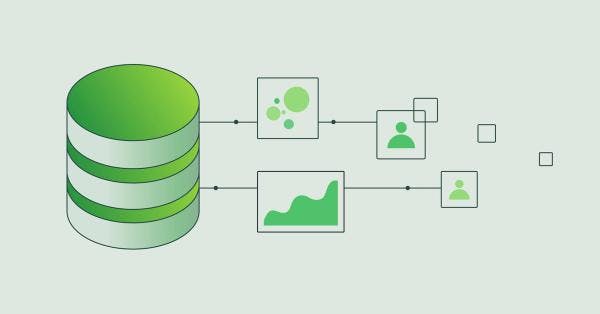
Tools like Hightouch Events let you embed an SDK within your product, and every time a user performs an action, a trigger is fired, capturing all the specific event data. Then, the data collected is sent to an analytics database, ready to be modeled for analysis.
Before you perform any analysis, you need to know what you’re trying to achieve. Is it to increase demos? Convert more customers from trial to paying customers? Whatever it is, you need to be clear, so you track the right product metrics and know what to optimize.
Once your product data is ready for analysis, you can reflect on your objectives and see how your product is performing in its current state. Then, to make improvements, you can brainstorm ideas for experiments to run.
Examples of Digital Products
The scope of digital products can be broad, but here are a few of the most popular examples:
- Subscription services are digital platforms where customers pay a recurring fee for ongoing access to your services or content. An example in this category is Spotify, a music streaming service that offers monthly or yearly subscription plans. With Spotify, users pay to access an extensive library of songs, podcasts, and playlists. To continue enjoying these benefits, subscribers must renew their subscriptions, ensuring a steady revenue stream.
- SaaS applications deliver software solutions over the internet, eliminating the need for installation or hardware investments. Hightouch is an example of this category, offering a Composable CDP that enables marketing and data teams to access active data directly from their data warehouse. Your SaaS application can have different tiers depending on the level of products you want, and your customer can pay monthly or yearly for their continued use.
- Mobile apps offer you the ability to use applications on a smartphone, so you have the flexibility to use useful software without using a computer or laptop. An example is TikTok, a social media platform that capitalizes on short-form video content. Revenue on TikTok is primarily generated through advertising on the platform.
- Digital games are interactive games you can play on your own or with other players on a computer or a console. Fortnite is a standout example, offering a free-to-play battle royale game that generates revenue by selling in-game items and passes.
- E-commerce tools help you facilitate the online buying and selling of goods and services, offering storefront creation, inventory management, and payment processing features. Shopify is a prime example of enabling you to set up an online store. This platform democratizes e-commerce, allowing you to start an online business with minimal technical expertise and for a monthly fee.
Product Analytics Use Cases
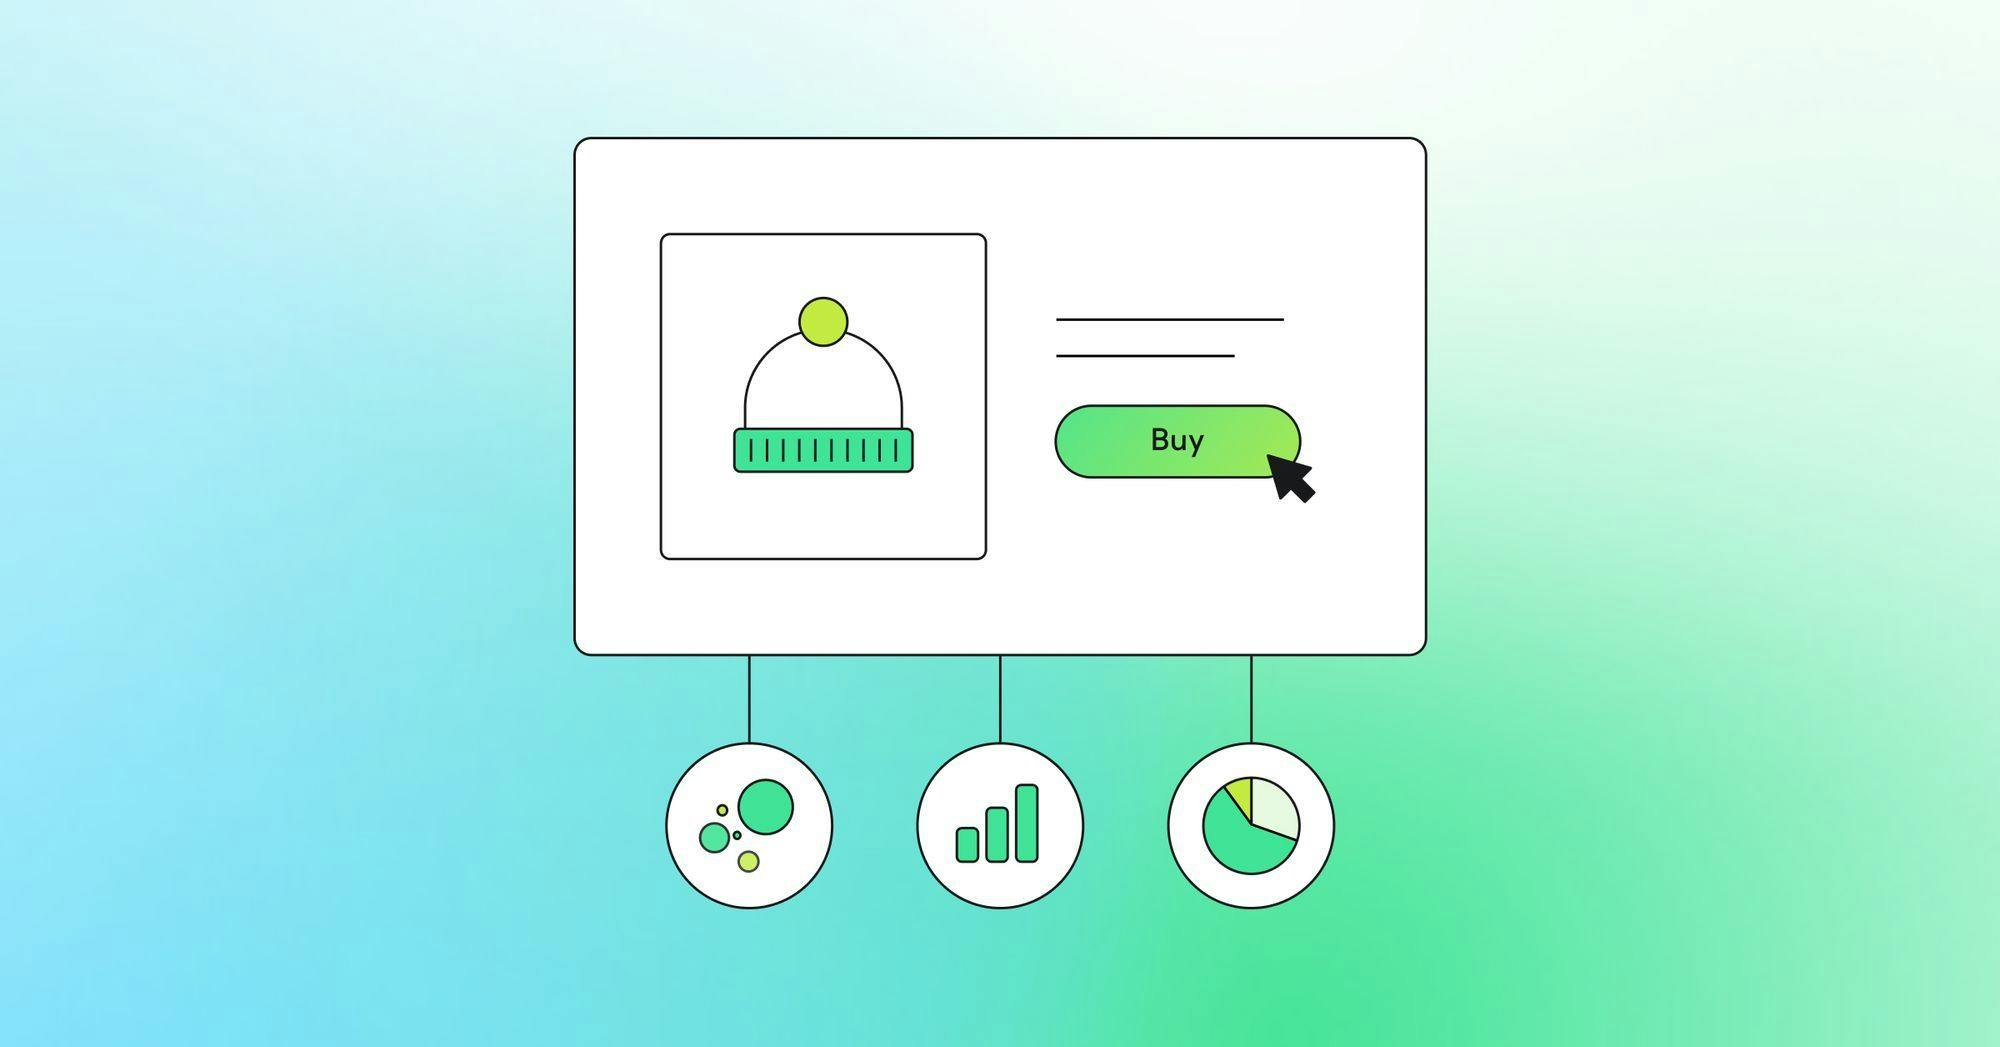
Product analytics allows you to dive deep into your user interactions and behaviors so you can perform a range of different analyses and tests to understand how your customers are engaging with your products.
A/B Testing
A/B testing lets you compare two variants, such as a webpage, feature, or element, and determine which performs the best. The goal is to improve your product by measuring user feedback.
For example, if you’re a large e-commerce company like Amazon, a key metric you might focus on is average order size. With A/B testing, you can measure the difference between serving and not serving product recommendations and how that impacts the number of products a user purchases and their average order size.
Feature Usage
Feature usage lets you see how many users are interacting with a specific feature of your product. This can help you understand which product features users leverage the most so you can focus your development resources on improving and developing features that drive revenue.
For example, if you’re an online streaming platform like Spotify, one of the key metrics you might focus on is total listening time. If you had a notification feature setup that notified users when their favorite artist released a new song, you could measure this feature's impact on the underlying metric to determine whether or not you should invest more development time into this feature.
Feature Adoption
Feature adoption lets you identify user engagement and patterns to understand what may cause your users to adopt a specific feature. The goal is to increase the number of users that adopt a certain feature.
For example, if you’re a social media platform like Instagram, you might want to monitor how users adopt new features. Imagine you launch a new feature like Instagram Stories, and only a tiny percentage of your users utilize the feature. This might tell you that it’s not worth pursuing or that you must spend more of your marketing budget promoting it.
Conversion Analysis
Conversion analysis helps you understand when a user takes specific user actions (e.g., signup, purchases, add-to-cart, subscribe) and what led them to convert. The goal is to identify friction points and simplify the user experience to avoid having users drop off in your sales/marketing funnel.
For example, if you’re an insurance provider like Statefarm, you likely need customers to fill out important information to deliver a better experience. However, you might find the number of data points you require a user to fill out directly impacts your conversion rate, so you could experiment by adding or removing fields to understand the impact.
Churn Analysis
Churn analysis allows you to understand what might be causing customers to cancel their subscriptions or stop using your product. The goal of churn analysis is to highlight customers who are showing signs of churn so you can implement strategies to retain them.
For example, if you’re an online video streaming company like Disney+ or Netflix, you probably care about your customer churn rate (or the number of users unsubscribing) so you can keep them engaged on the platform and deliver value to them. With churn analysis, you can determine exactly where and why users are churning. For example, you might notice that a certain household only watches Star Wars content, so personalizing their homepage with other sci-fi content might encourage them to watch different content and subsequently reduce their risk of churning.
Audience Analysis
Audience analysis helps you to understand your user base based on certain attributes, such as country, gender, etc. The goal is to help you segment your customers so you can develop personalized experiences.
For example, if you’re a giant retailer/e-commerce company like Target, you might want to understand what items different demographics purchase. With audience analysis, you could understand exactly what products people in the UK purchase vs. people in the US to create and deliver more personalized homepage experiences based on what’s trending in their location.
Attribution Analysis
Attribution analysis helps you to identify how your marketing funnel creates paying customers. It can be used to see the impact of changing the funnel on conversions through attribution models such as first-touch, last-touch, and multi-touch.
For example, if you’re a SaaS application like Hightouch, you likely want to know where your customers are coming from or what channels impact your conversion rate. With attribution analysis, you can directly measure your conversion rate to see whether SEO or paid ads have a bigger impact.
Product Analytics vs. Web Analytics vs. Campaign Analytics
Product analytics is only the tip of the spear; if you truly want to understand how your users interact with your brand, you also need to leverage web analytics and campaign analytics in parallel.
While product analytics focuses on providing the best product experience possible to your users so they can be successful in using your app, web analytics and campaign analytics address slightly different use cases.
Web analytics helps you track how users interact with your website by capturing data such as what they engage with, what products they are interested in, and where they leave your site. Knowing how your users interact with the site means you can understand how they navigate your site.
Campaign analytics involves collecting and analyzing data about the marketing campaigns that you’ve launched. You collect data such as clickthrough rate, time spent on content, and conversion rates. Campaign analytics helps you understand how your campaigns perform based on direct customer feedback so you know what’s working and can optimize your campaigns for a higher ROI.
When you combine all three, you can have the insights to create an excellent user experience that will keep users coming back.
The Best Product Analytics Tools
The product analytics space is pretty flooded, which makes evaluating tools difficult. With that in mind, here’s a quick summary of the top product analytics platforms available on the market today.
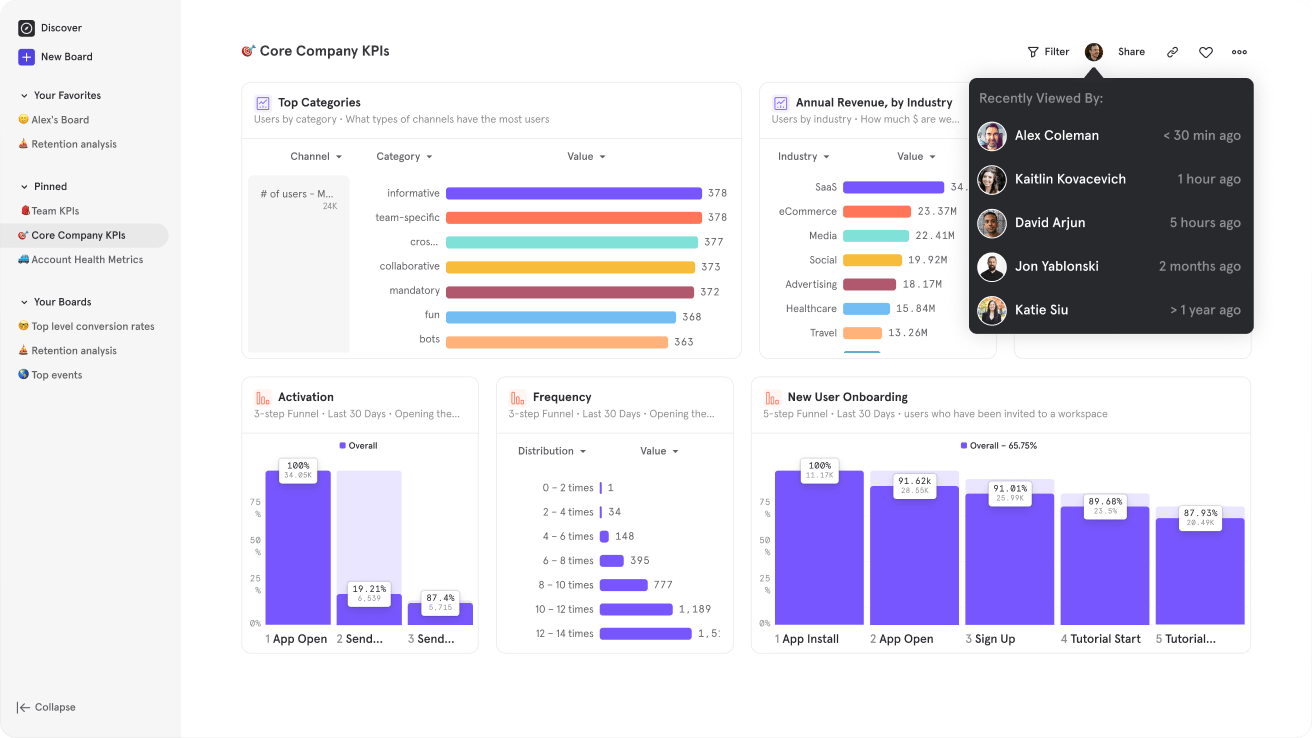
Mixpanel
Mixpanel is an analytics platform focusing on user interaction with web and mobile applications. It provides valuable customer insights into user actions, enabling you to see how they behave and where areas in your product may need improving. Mixpanel also provides funnel analysis, A/B testing, and user segmentation, which can help measure and perform experiments within your product.
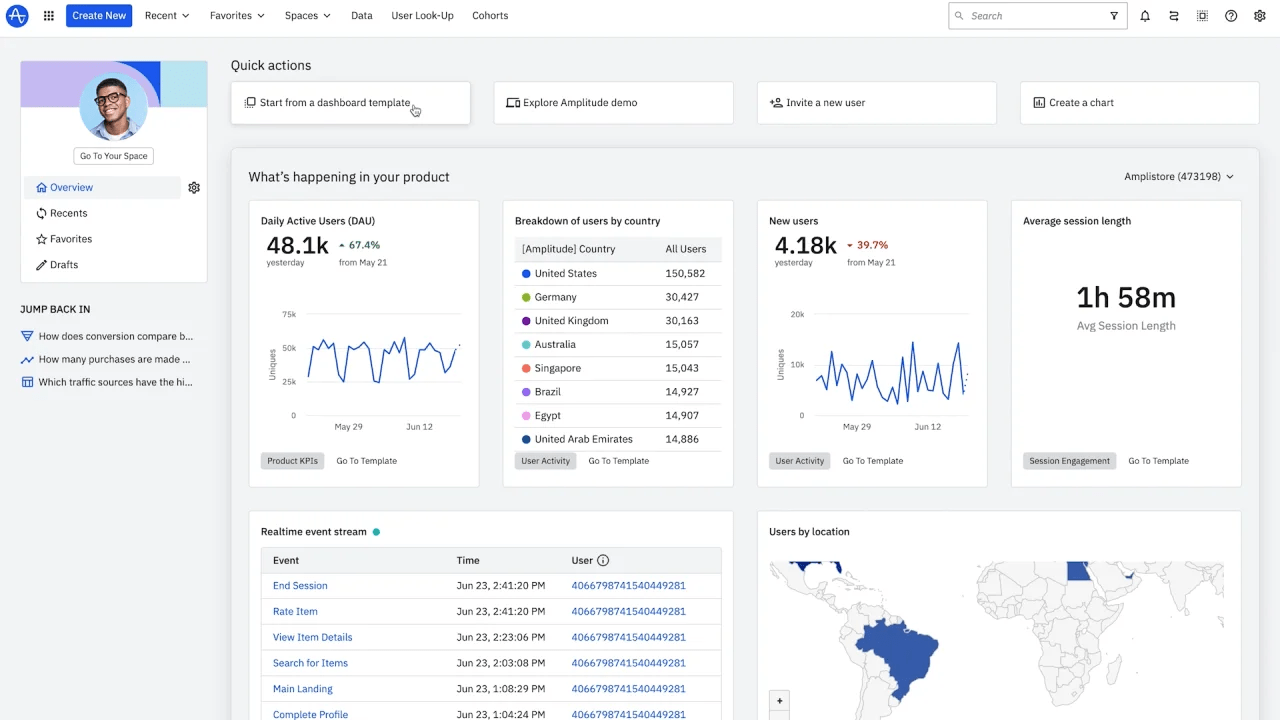
Amplitude
Amplitude provides analytics for mobile and web products, providing actionable insights into customer behavior in your product. It offers event tracking to track user actions, such as clicking a button or completing an onboarding flow. The platform can also analyze a user's path through your product to help you understand the customer journey.
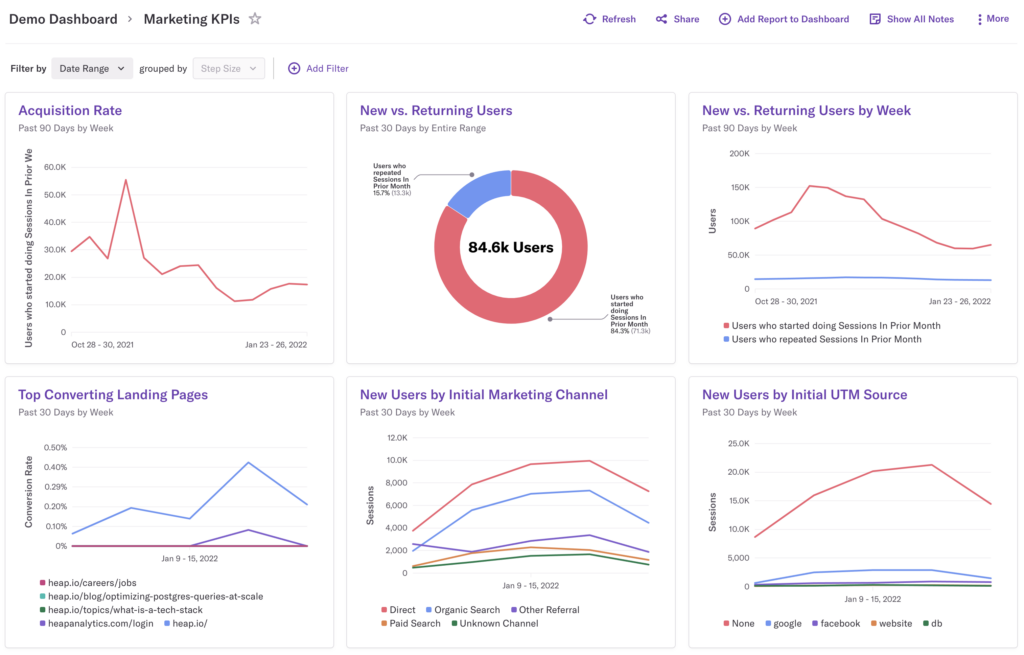
Heap
Heap is a digital analytics platform that automatically captures every web, mobile, and cloud interaction without you implementing it manually. The platform allows you to quickly identify product trends, pinpoint improvement areas, and measure the performance of experiments. Heap is useful for optimizing the customer experience and increasing your important product metrics through detailed analysis of user interactions.
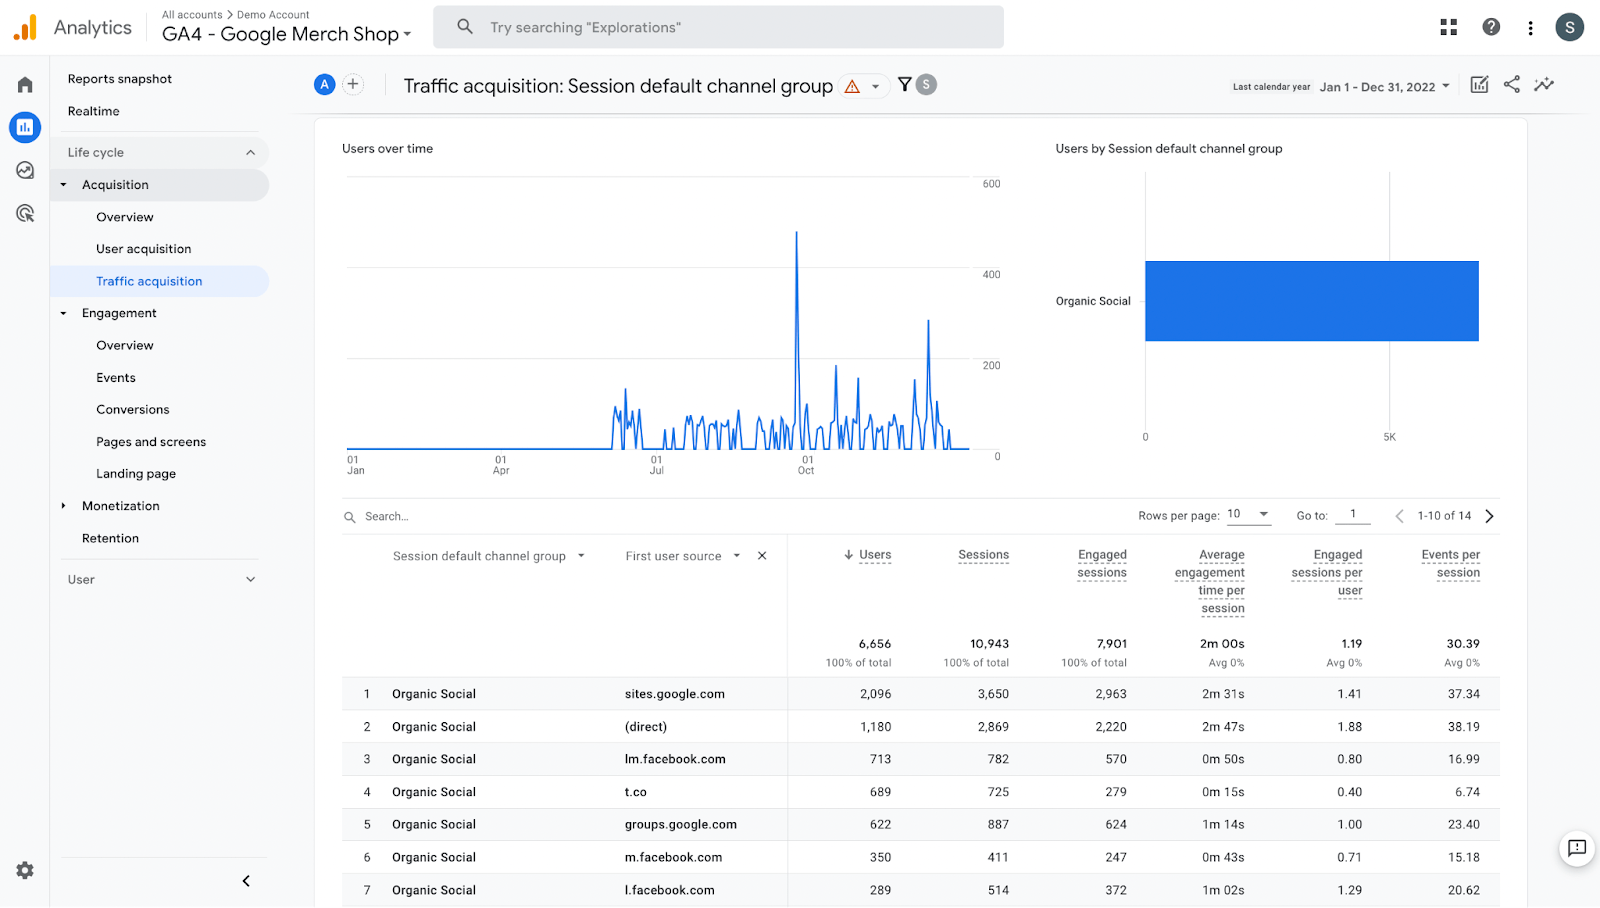
Google Analytics 4
Google Analytics 4 is a free, widely used product analytics solution. It helps you track user interactions with your product so you understand what features users are interacting with and how successful they are with it.
The platform gathers data through JavaScript tags (known as “gtag.js” or “analytics.js”) that integrate into your product’s code. As a user navigates your product, this tag activates, capturing information to Google Analytics servers. You can track customer interactions by configuring event monitoring, like clicking buttons, navigating through a series of steps, or filling out forms.
Final Thoughts
To effectively leverage product analytics, you need a tool that helps you collect and analyze the right data. Hightouch provides a complete suite of marketing-friendly tools to capture product analytics and take action on that data to drive value for your business.
If you’re interested in learning more, book a demo with one of our solution engineers to learn how Hightouch can help you understand how your users are leveraging your product so you can deliver personalized experiences and build features that your users love.