The Science Behind Spotify Wrapped: Tracking 500M Users
Spotify Wrapped is consistently one of the most viral marketing campaigns every year, but what exactly does it take to build and power this level of personalization?

Tejas Manohar
November 30, 2023
7 minutes
Chances are you’re familiar with the famous Spotify Wrapped campaign. It’s one of the largest and most viral marketing campaigns every single year. The company synthesizes over a year’s worth of data into a few core metrics and insights unique to each user. While Spotify wasn’t the first company to build and deliver this type of marketing campaign, it pioneered how brands now interact with their customers.
This blog post will explain exactly how Spotify Wrapped works and why the campaign is so successful.
What is Spotify Wrapped?
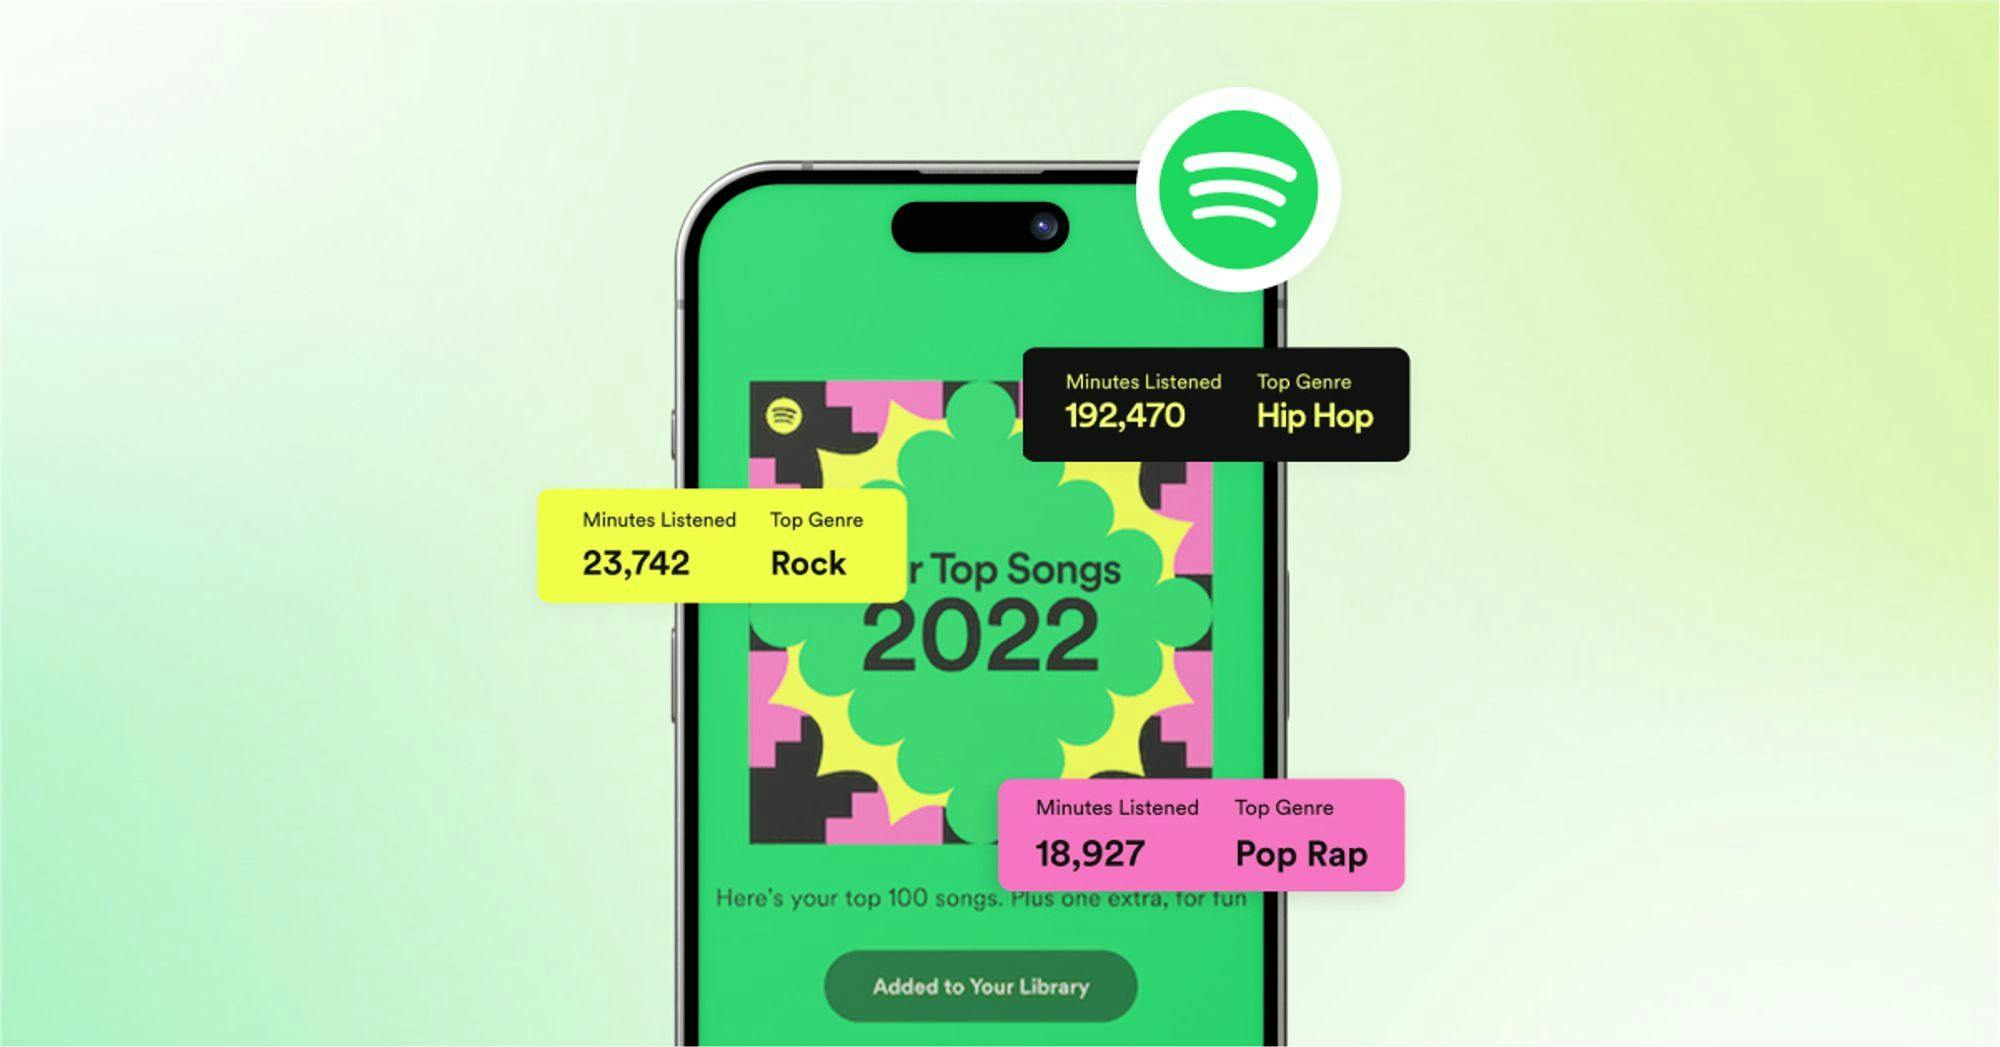
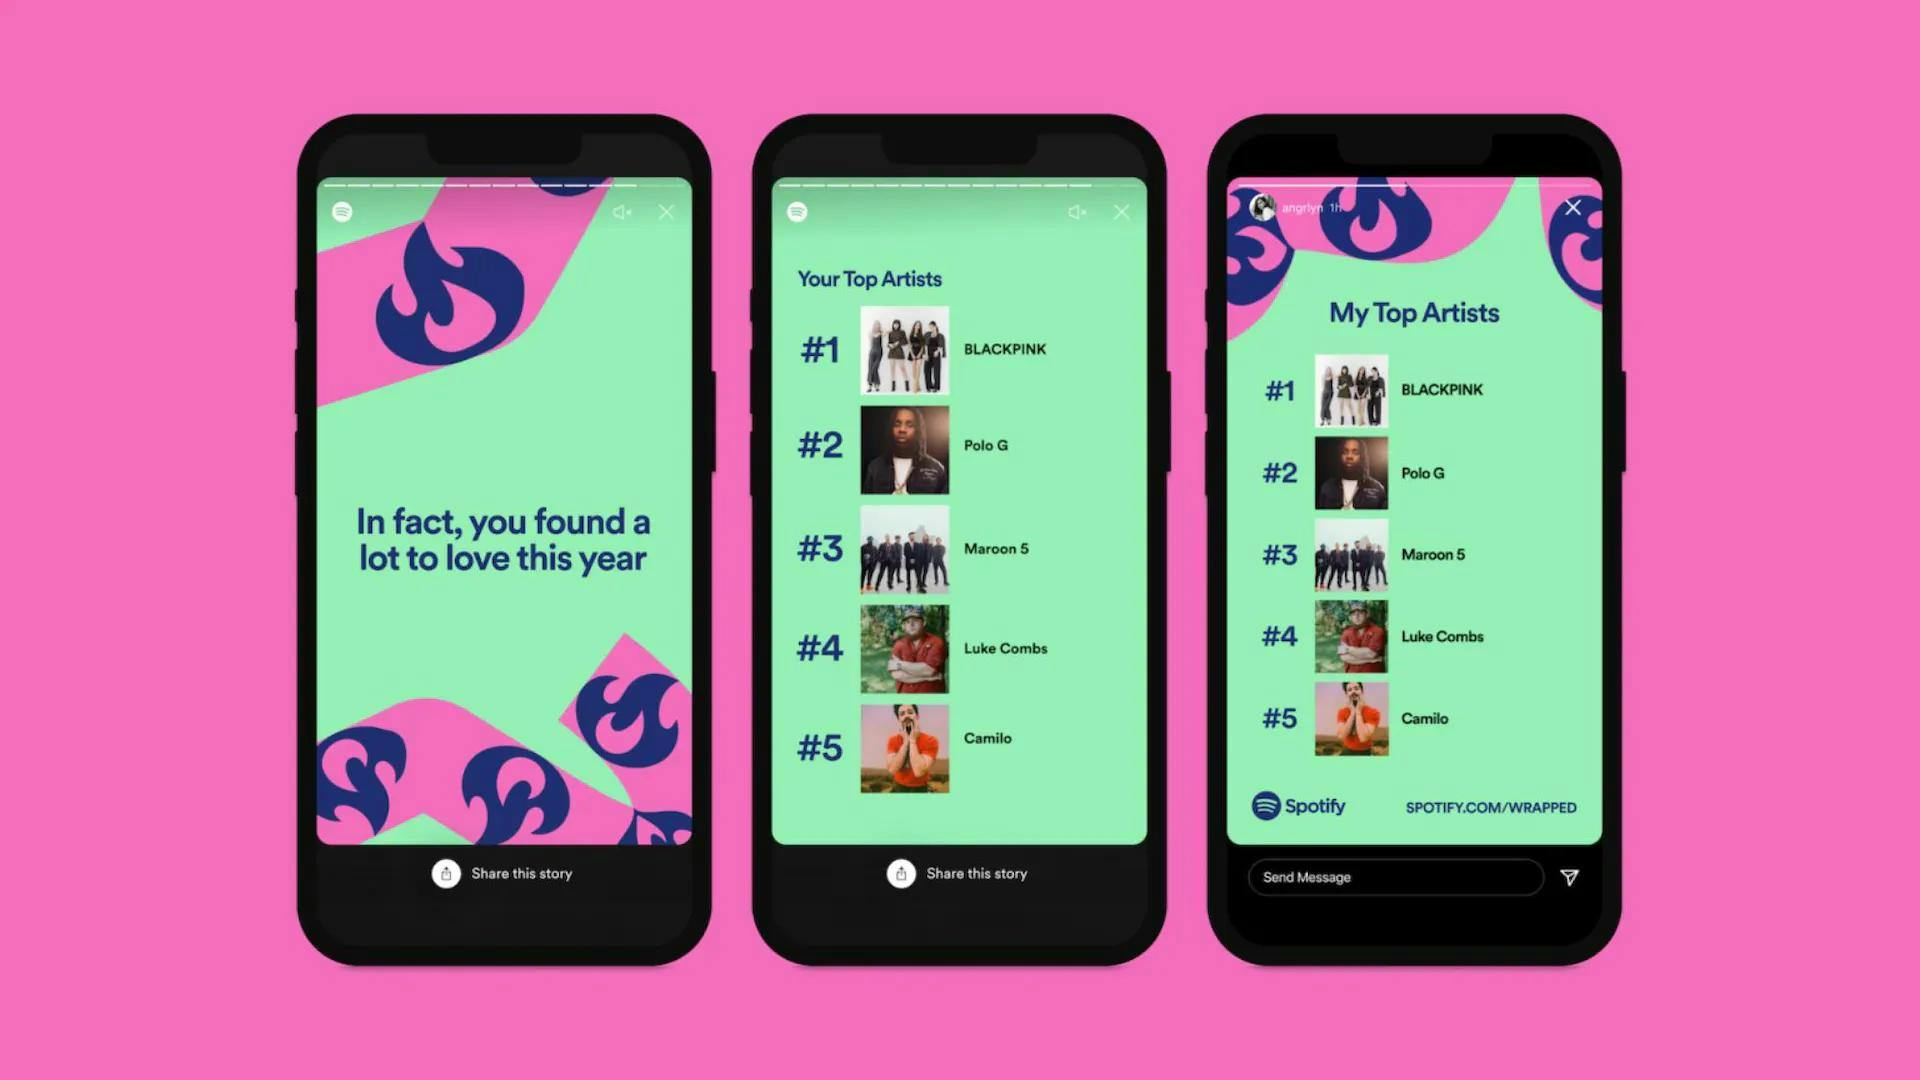
Spotify Wrapped is an annual marketing campaign that Spotify launched in 2015. Back then, the campaign was known as the “Year in Music,” and it was subsequently changed in 2016 to “Spotify Wrapped.” Every December, Spotify delivers product usage metrics to over 574 million users globally. Each Spotify user receives a unique compilation of their top songs, artists, genres, total minutes listened, etc. All of this information is delivered via email or made available directly within the Spotify app so you can see what you listened to over the previous year and share it with millions of users worldwide.
How Does Spotify Wrapped Work?
It’s pretty easy to understand Spotify Wrapped as an app's end-user, but understanding the complexity of building and powering this type of marketing campaign at such a large scale is a bit more nuanced. Building a year-in-review campaign like this is surprisingly complicated, especially given Spotify’s scale. Given that the average Spotify user in the US streams about two hours per day or roughly 743 hours per year, it’s a pretty incredible amount of data to surface, especially when you add in the fact that Spotify offers over 100 million different tracks–and that’s not even counting podcasts or audiobooks.
In fact, there’s even a Quora thread from a former VP of engineering who claims that Spotify had between 150-200 petabytes of data around 2016, so you can imagine that the company has probably crossed into exabytes of data these days. In other words, what looks like a giant marketing campaign is, in reality, a really sophisticated data project powered by three fundamental pillars: data collection, data modeling, and personalization and activation.
Quick Disclaimer: I do not have any knowledge of the actual architecture behind Spotify Wrapped. The data engineering team at Spotify provided little bit of insight into this process in 2020, but the following description is based on my own experience building and designing many similar systems. Here at Hightouch, we actually build a year-in-review campaign every year.
Data Collection
In order to deliver insights, Spotify collects a ton of behavioral data about how you’re leveraging the app. This includes data from the company’s web app, mobile app, and back-end servers to understand what you’re listening to. This information is used to understand behavioral preferences like:
- What and who you like to listen to
- Metadata about your listening habits
- How your behavioral patterns change throughout the year
- Your device type (are you listening on an Android, iPhone, or SmartTV?)
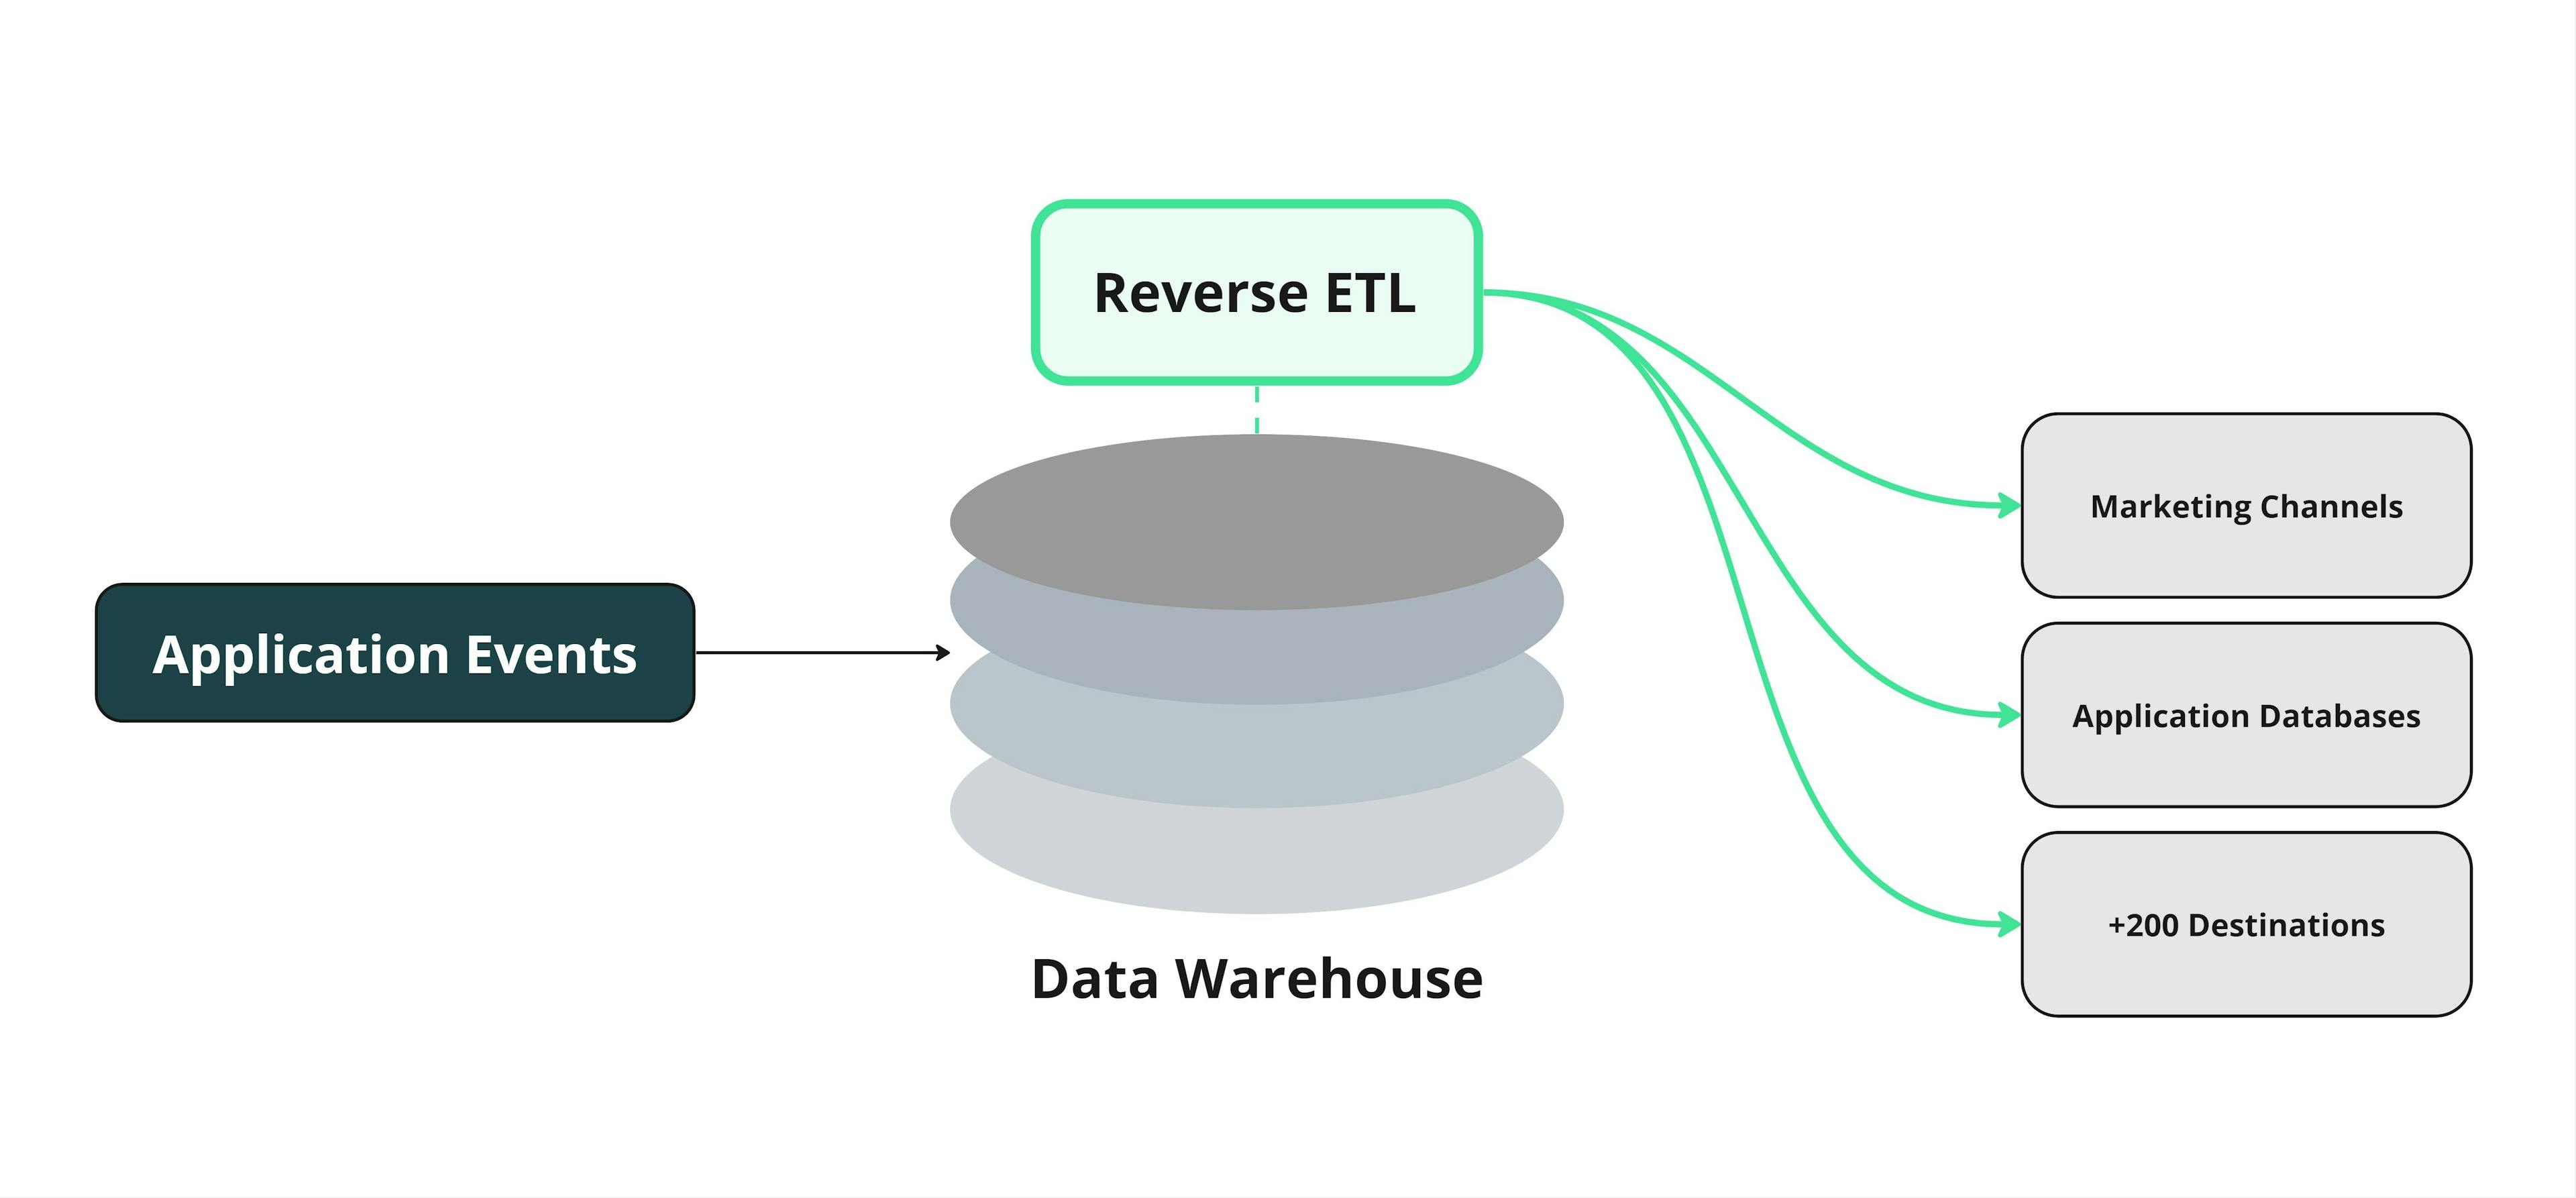
Spotify collects millions of events across all of these different mediums. Every time you log into Spotify, every action you take in the app is captured as an event and then sent to a central location (most likely a data lake or a data warehouse), where that data can later be transformed, modeled, and analyzed for future use.
Data Modeling
Once this data has been ingested into a single repository, Spotify’s data team is able to join it together easily to compute metrics on top of all their user data to answer questions at both a global level and an individual level. This includes everything from:
- Favorite songs, albums, and artists
- Minutes listened
- Favorite playlists
- Listening personality
To calculate these metrics, the data team has to combine millions of events and aggregate this data for every single user, which is a huge data modeling and data science task. The amount of processing power that Spotify has to purchase for this type of complex number crunching is probably extremely high.
Personalization And Activation
The final layer of the Spotify Wrapped campaign is the actual delivery and personalization to the end user across marketing channels and product experiences. While some of Spotify’s systems may be able to read directly from their databases, Reverse ETL pipelines can be used to push the granular data points out from the data warehouse to whatever systems and channels it's needed in.
When Spotify first launched Wrapped in 2016, Data Activation was a complex and resource-intensive process to stand up and maintain. For companies launching Spotify Wrapped-like campaigns today, the emergence of Reverse ETL has simplified this process.
What Makes Spotify Wrapped so Successful?
On the surface, it’s easy to think that Spotify Wrapped is just a really personalized marketing campaign (which it is), but there are a couple of reasons why the campaign has proven to be hugely successful year after year.
- Inherent Value: Spotify Wrapped provides inherent value without asking for anything in return. All you have to do is use Spotify, and you’re automatically enrolled in this marketing campaign. It’s a tangible way to see just how much value you received from the app.
- Virality: The campaign is designed to go viral. Spotify lets you easily share your “Wraps” on social media directly from the app. This means that once per year, Spotify is able to weaponize millions of users to promote their product for free, and that’s not something you can place a value on.
- FOMO: Anyone not using Spotify is barred from engaging or participating in Spotify Wrapped. Seeing others share their music trends immediately makes you want to get involved and download the app so you can participate.
Closing Thoughts
Spotify Wrapped is one of the most successful marketing campaigns in the 21st century. In 2020, the campaign increased app downloads by 20 percent, and in 2022, it was estimated that the campaign was shared over 100 million times on social media. If you think about this campaign from Spotify’s viewpoint, it’s basically the north star for the entire organization, and it’s the pinnacle of everything the company does. Almost every team across the business works on this campaign in some capacity.
Today, every company is looking for a competitive advantage. If you truly want to stay “top-of-mind” with your customers, then you need to deliver value without expecting anything in return. Spotify Wrapped asks nothing of the user, but it gives everything. The campaign is individualized at an extremely personalized level that’s not easily replicable. If you’re interested in launching your own year-in-review campaign or tackling any type of complex personalization use case like this, book a demo with one of our solution engineers, and we will walk you through the process.