A Deep Dive into Hex and the Future of Data Apps
Learn about Hex, a collaborative data analysis platform, and the future of data apps built on top of the data warehouse

Pedram Navid
October 6, 2021
9 minutes
I had the pleasure of getting early access to Hex over the past few weeks and it's starting to shape a lot of my thinking about what the future of data apps might look like, and how data in general can start to learn more from the field of design.
On the surface, Hex is a collaborative data analysis platform that enables data people to ingest, explore, and visualize data using both Python and SQL. It may not appear that different from tools like Jupyter Notebook, RStudio's excellent IDE, or even Shiny apps, but the more time I spend with it, the more I think there's an exciting potential here.
Collaboration in Hex is not just an add-on, but a core part of the product functionality. In many ways, you can see the link between the success of a tool like Figma, and the design philosophy of Hex. Kevin Kwok's excellent view on why Figma was such a successful product can help us better understand why Hex might win too.
Hex enables an iterative workflow where you can design data applications for use by your stakeholders. Being able to share the app in development with your colleagues means that you can test your assumptions about what makes sense and what doesn't instantly.
Let's dig through Hex, with the caveat that Hex is in active development so some of this might have changed since I've written it.
An Imaginary Project
To help make this overview a little more fun, let's imagine a scenario. We've noticed our customer success team is often spending a lot of time writing queries and asking for help when trying to better understand our customers.
We've decided to pair with them on a project to help make the common questions they ask more readily available. After spending some time with them, we've come up with a few recurring scenarios:
Our success team:
- Wants to be able to look up a workspace or user id by email address
- Wants to gain an understanding of what type of activities they've recently accomplished in our app
- Wants to know what sources and destinations they have setup
We could solve this using SQL that we send them to run, but we think an app might be a better experience for everyone involved, so we're going to build our first Hex App for them.
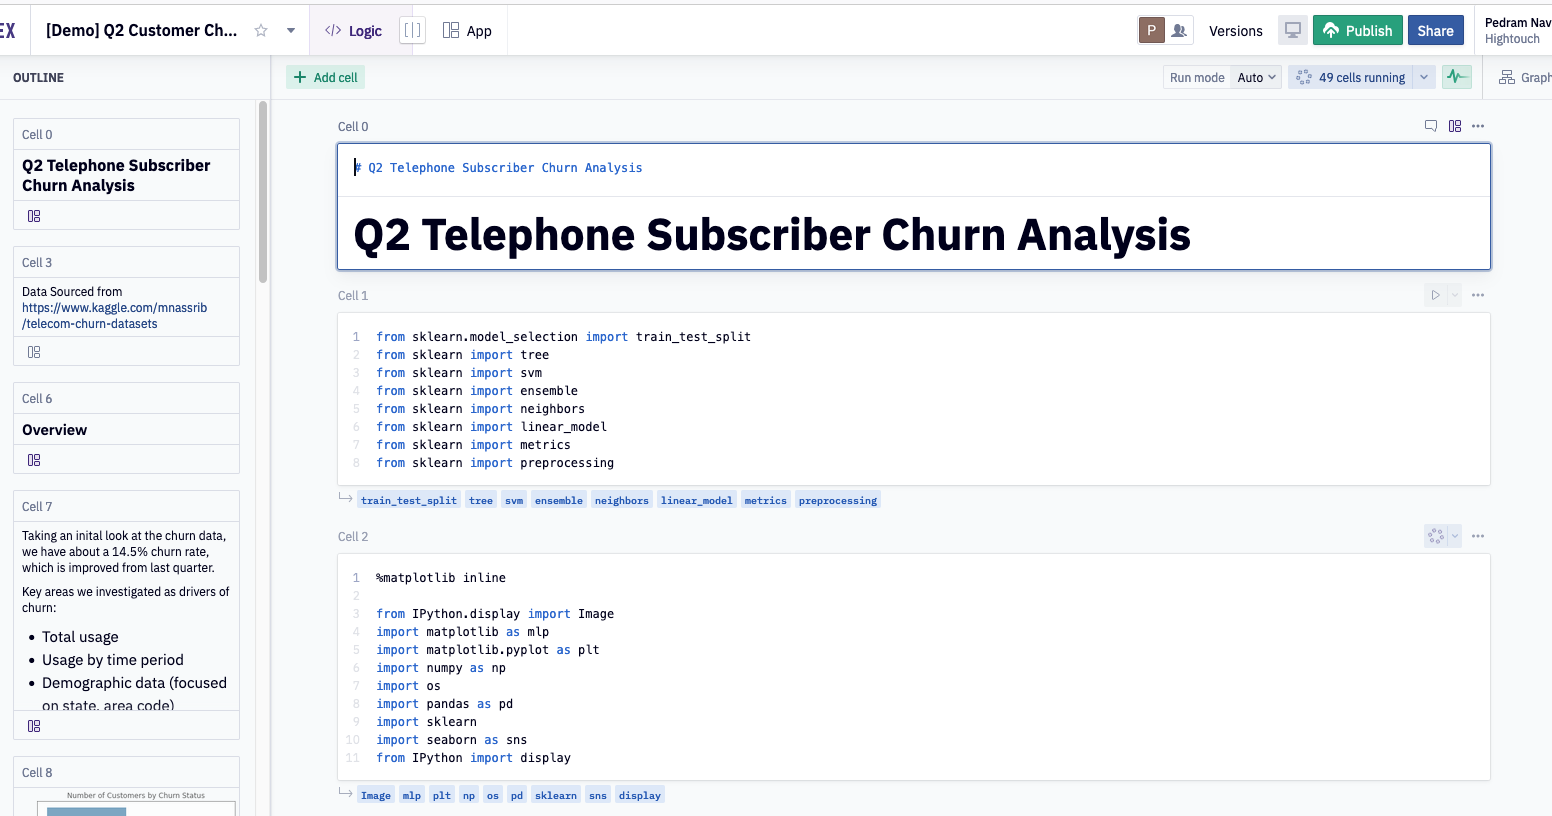
Creating a Project
The latest version of Hex offers a reactive analysis format. If you're used to traditional notebooks like Jupyter or R Studio, you know that your only option for running cells is from top-to-bottom or one-at-a-time, but has built an internal DAG of your analysis and can infer the dependencies of one cell downstream to all other cells, meaning you can ask Hex to only run cells that would've changed in response to a change in your upstream inputs. For our example, we'll use the Reactive mode, because it's way cooler (and I managed to get early-access)
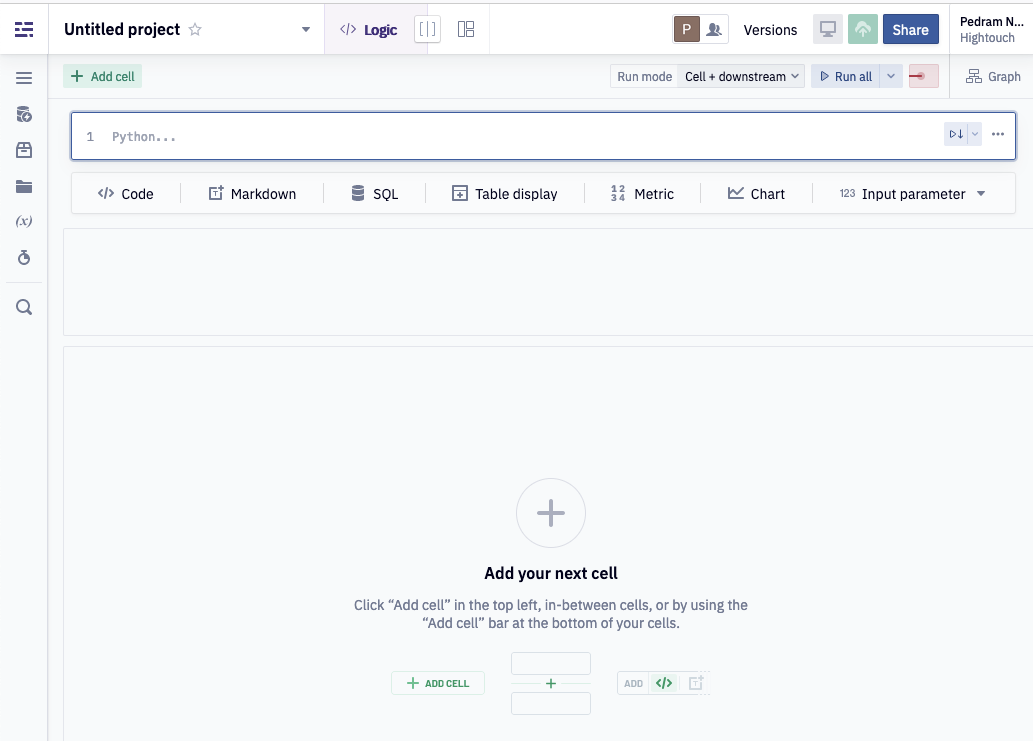
The first thing we'll do is update the name on the top left so it's no longer called Untitled Project. For now, Customer Success demo will do.
Getting Data In
As with any data analysis project, the first thing you'll want to do is connect to some data. Hex shines here, with intuitive access to everything from a database, a data warehouse, or even a CSV file.
Data sources can be added at an organization level, which is common for things like data warehouses and databases, but also at a project level, perfect for one-off connections, and demos.
Hex has a great schema browser built-in, and navigating through the schemas, tables, and columns in my browser is a breeze, and somehow faster than the native Snowflake UI that I'm testing against.
Querying Data
Once you've added a source, querying data is as simple as writing some SQL.
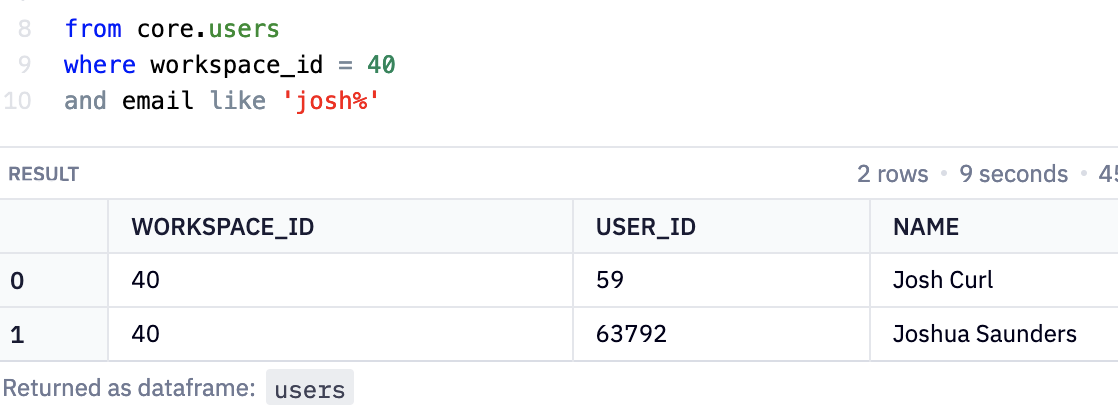
We're not quite sure what data we want, or how we're going to structure our final app, so for now, let's try and see if we can build a simple query to look up a user and a workspace just by using an email address. For our example, we'll limit everything to the Hightouch workspace so we don't accidentally share information about any of our real customers.
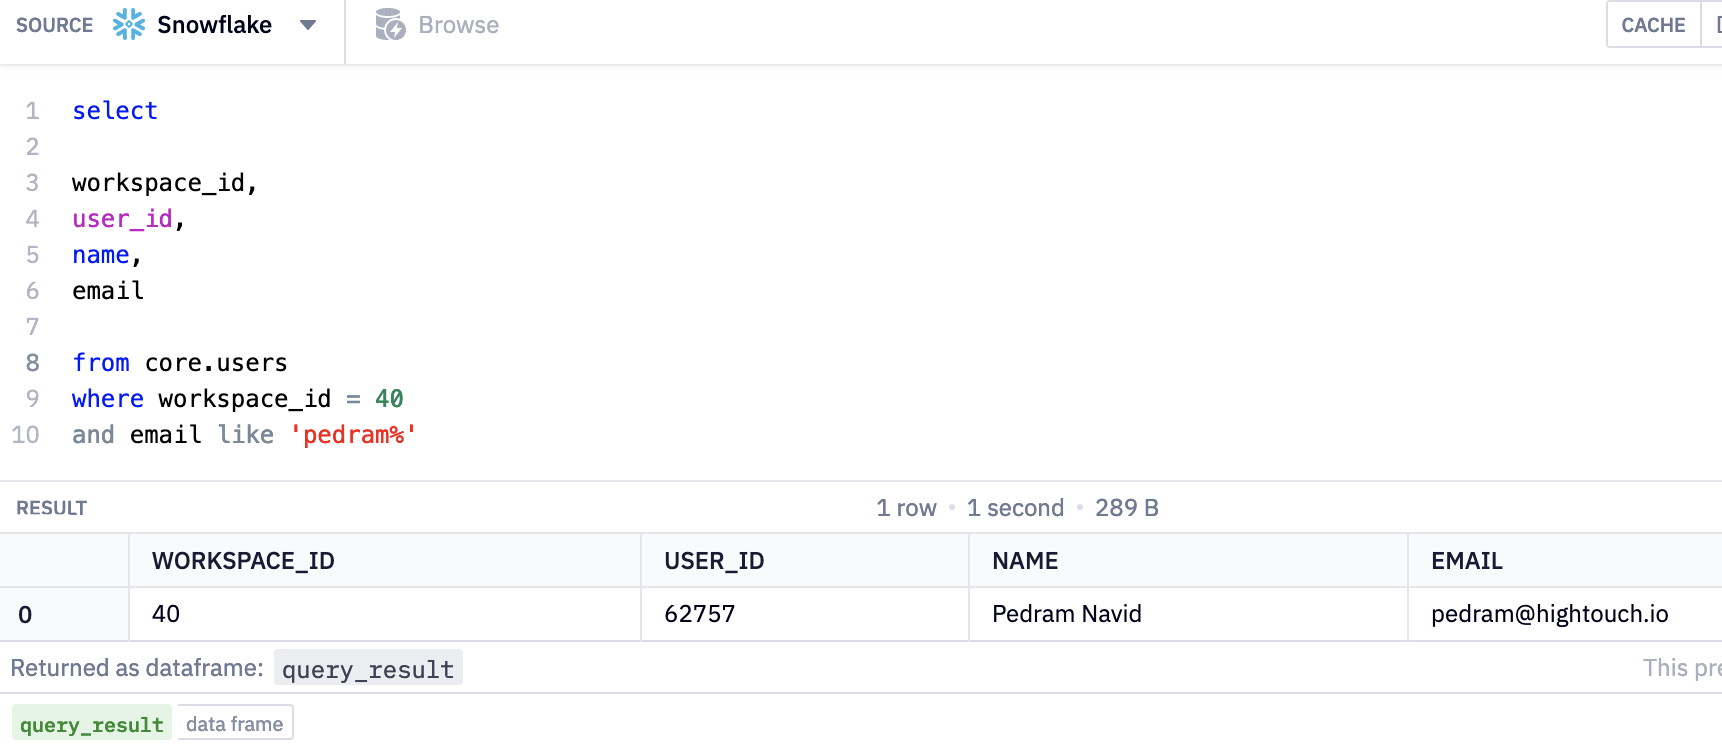
This is a step in the right direction for our first problem. One thing you might notice is that the result was returned as a data frame called query_result. Let's rename this something more sensible, simply by double-clicking and giving it a new name.
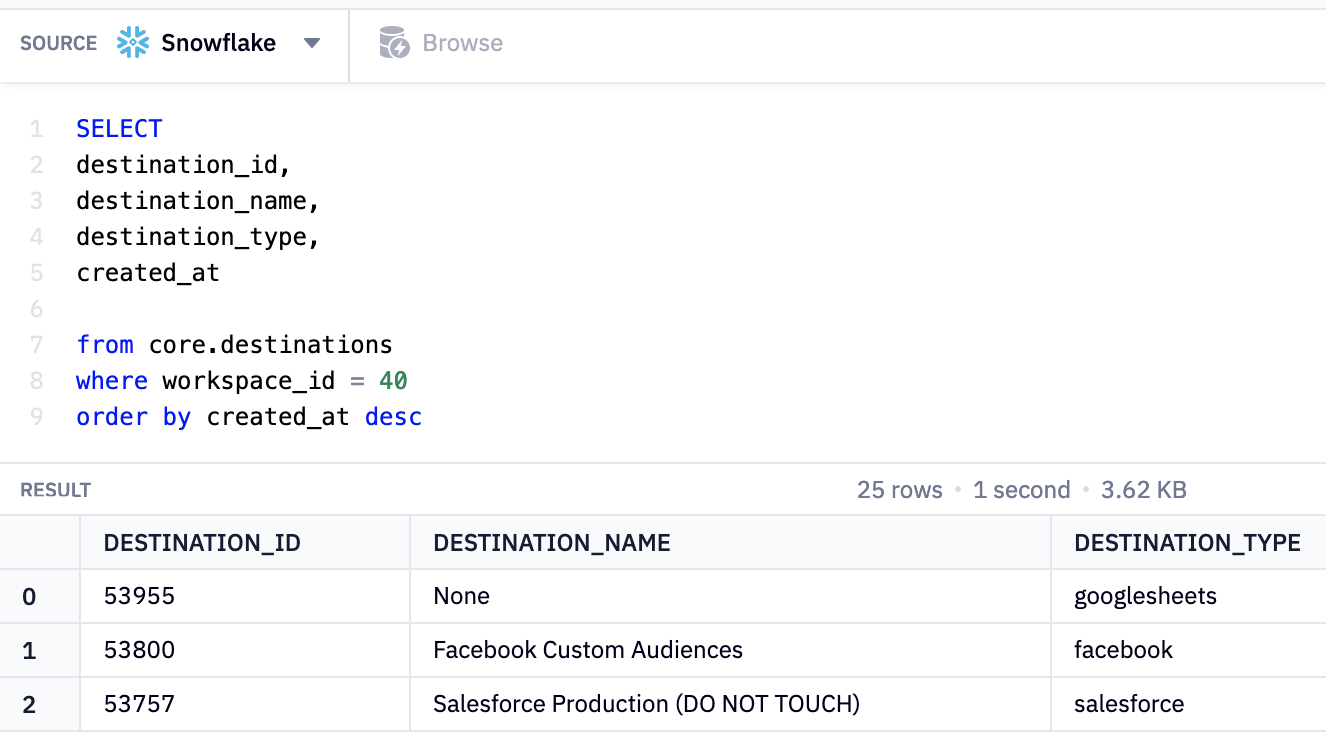
Let's see if we can get the data on the other two questions now.
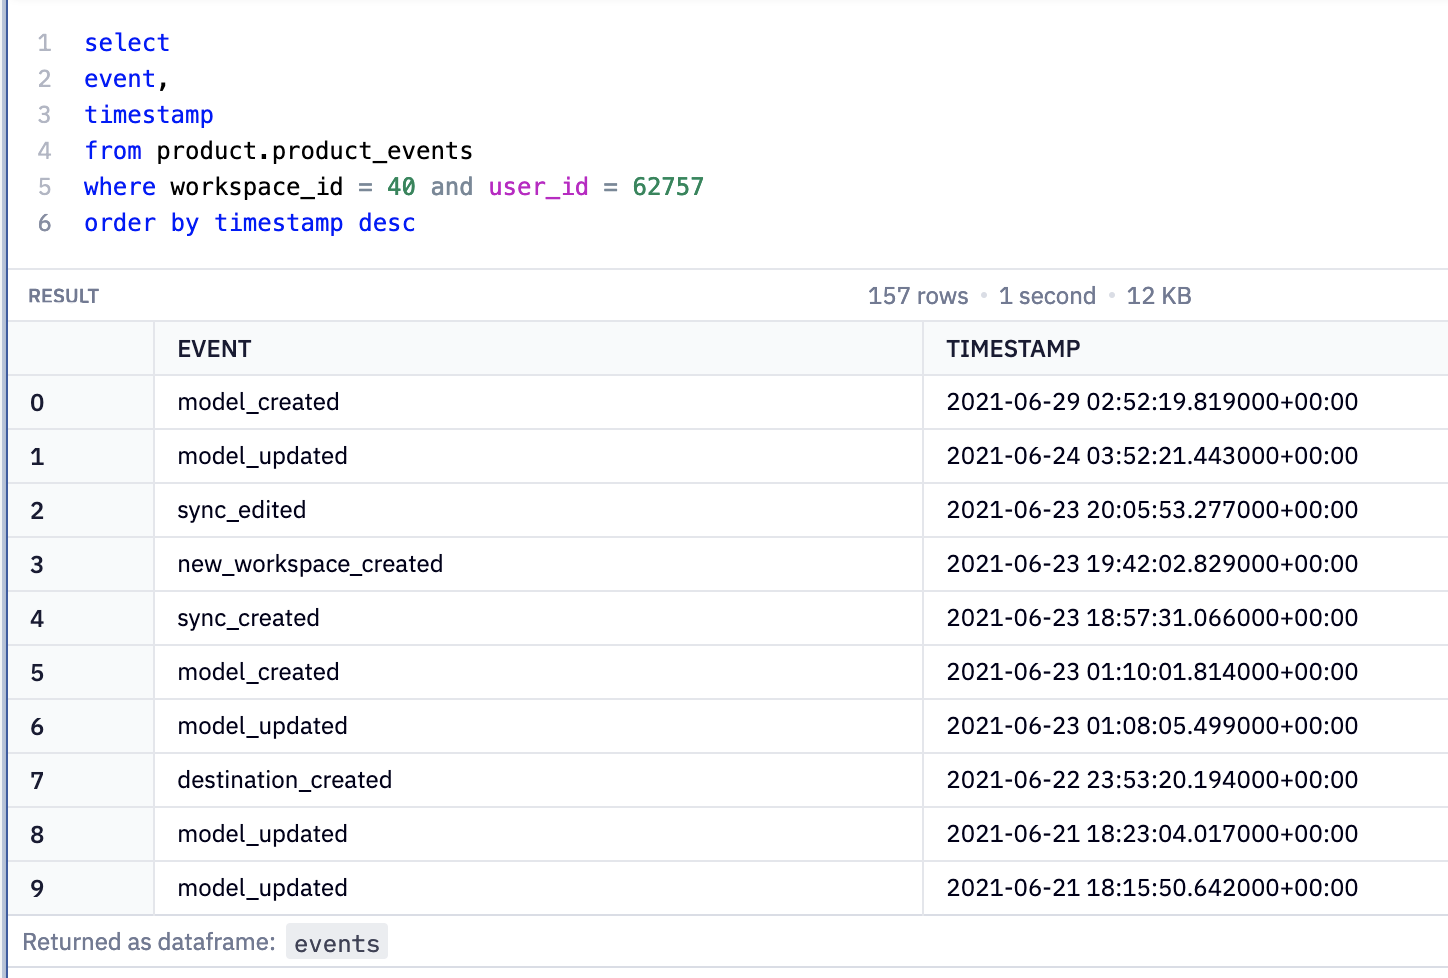
There's our list of product events, and just as easily, our destinations.
Adding Dynamic Inputs
While we're in a good place, it's easy to see there are a few places we can improve. Having to manually write the user id filters for the 2nd and 3rd queries is painful. What if we could leverage the results of the first query to filter the others for us?
Since the first query could return one or more results, for example, when searching for a name like Josh, we'll want to let our users pick which customer they care about.
Let's add a Code block, where we can write some Python to express the possible items in our list.
user_id_list = users['USER_ID'].tolist()
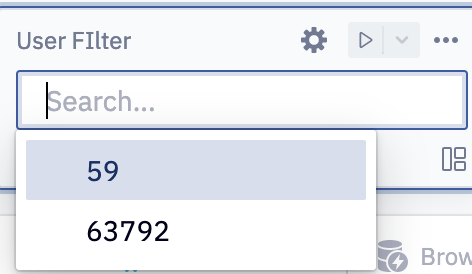
And then create a multi-select drop down like so:
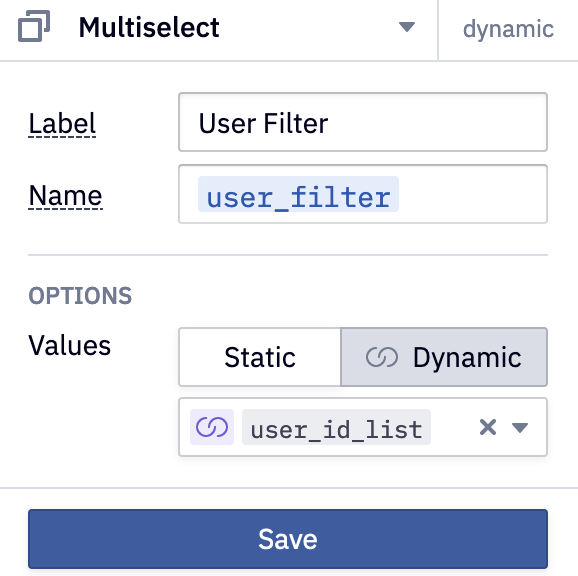
And we can see two user ids now show up when searching for Josh.
Now this is where the fun begins. We can start templating out our SQL using the User Filter our users have selected. We wrap the name of our filter in {{ ... }}s and Hex will compile our SQL down for us.
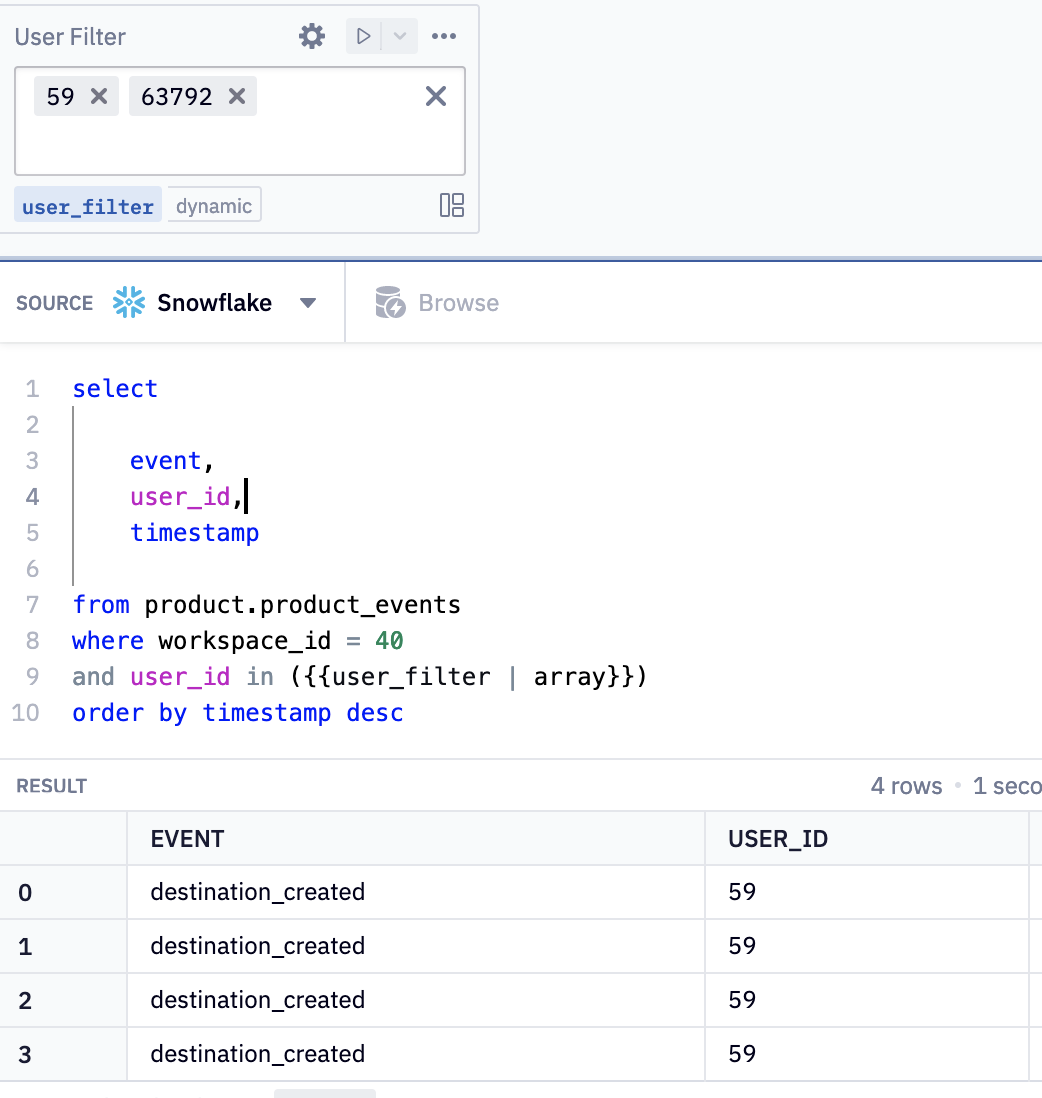
We'll add a similar filter for our last query:
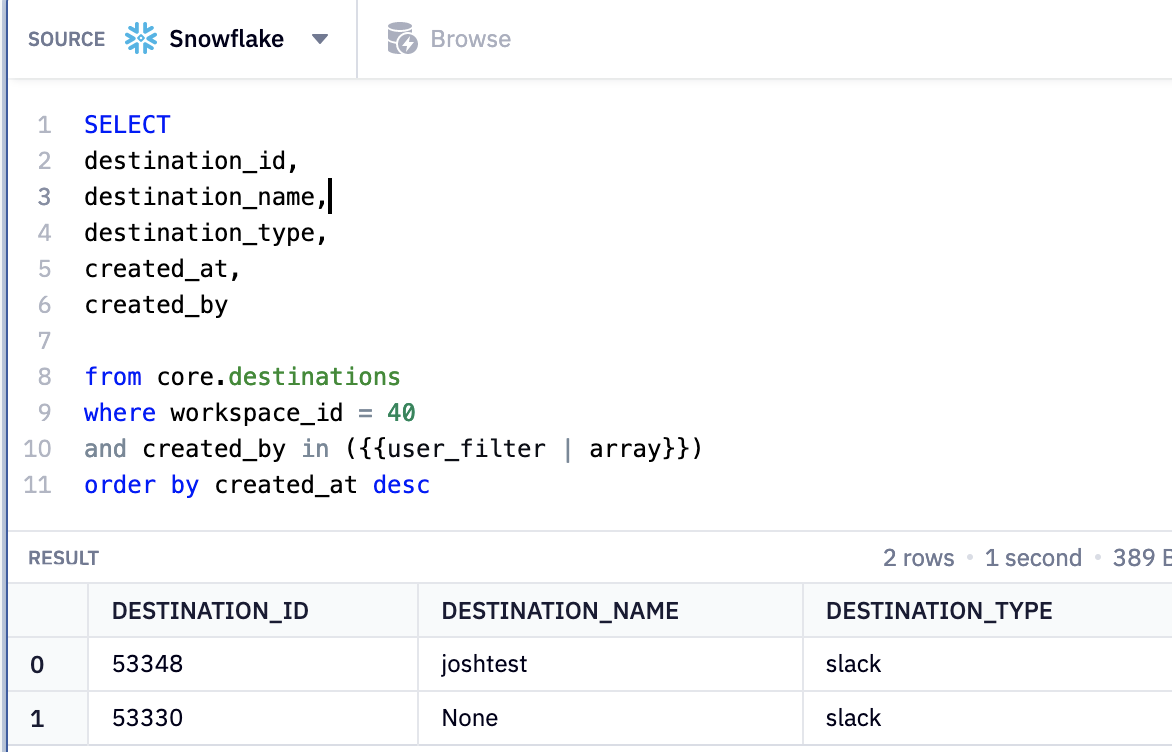
And now our 2nd and 3rd queries will update dynamically as our user's pick the user_id they wish to filter on.
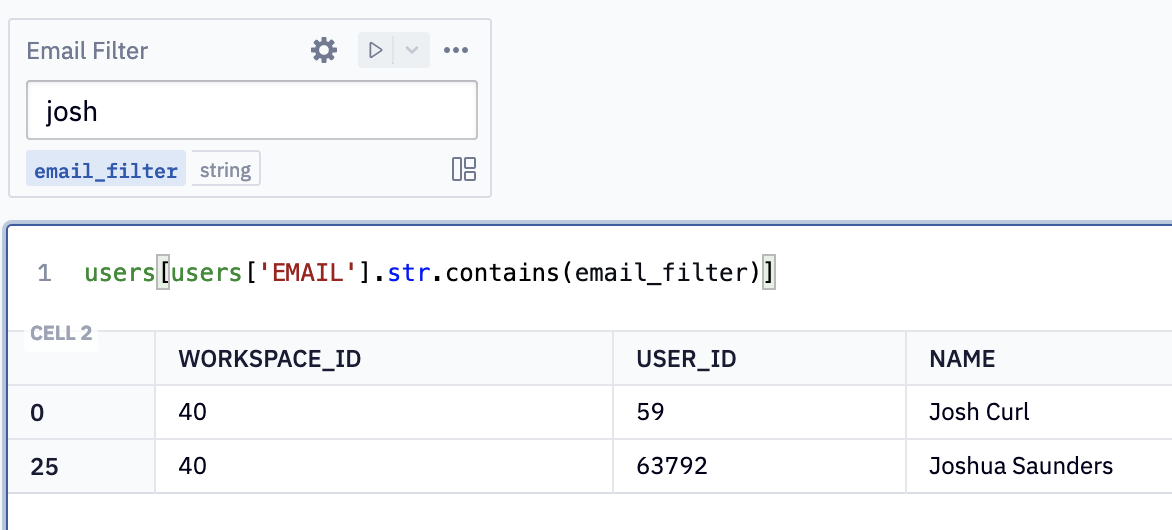
But there is still one issue, in our first step, the email address is hard-coded into the SQL. Let's take care of that with another input, this time a text-box, and we'll also add some Python filtering to show how we can take data from SQL into Python and back easily.
You can see here we're using Python to filter using a text box input, rather than SQL, but the principle is the same. You can use whichever language gives you the flexibility you need, which is really powerful.
One neat trick we can leverage is this little box on the top right:

Once we update our cell blocks, Hex can run only the cells that have the updated cells as dependencies.
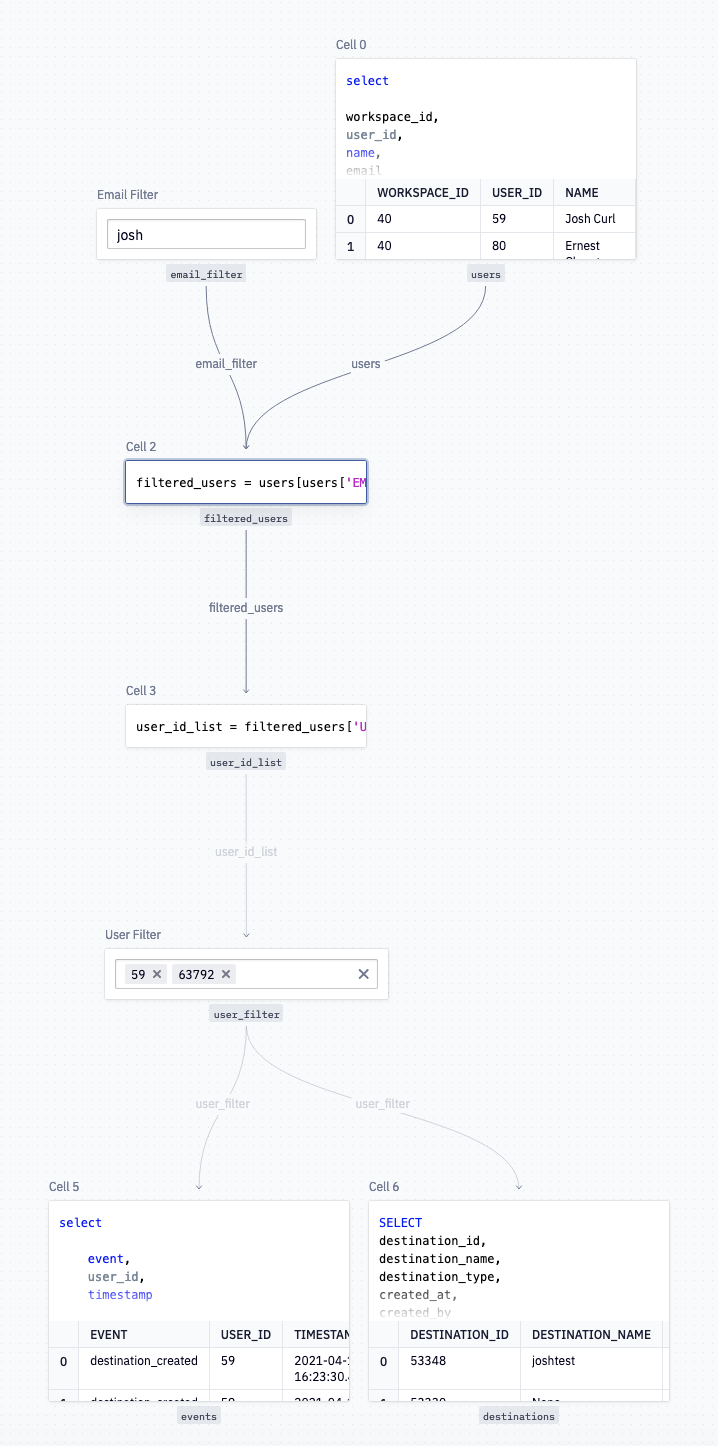
That's not all though, we can get a graph view of our work! Now it becomes easy to visually model the workflow you've built within Hex, instead of trying to keep it all in your head.
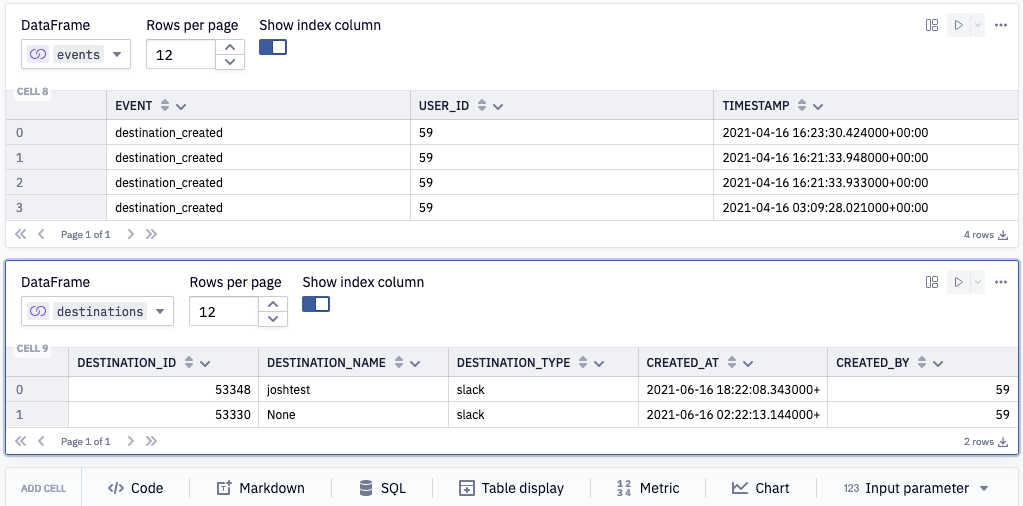
Creating Table Displays
We're almost done. To recap, we've created our queries, made them dynamic using inputs, and now we want to display the results to our users. We'll do this using the Table display cell. While our normal cells offer a preview of the data, the table display lets our users see a paginated view of all the data from a variable.
We'll create three tables, one for users, events, and destinations.
Putting It All Together
Now we're ready to jump into App view and create the view we want our Customer Success team to see. We don't want to confuse them with all the various SQL queries we built, but only the inputs and outputs that are relevant to them.
We'll jump into App View and pick Canvas mode as it's made for building small tools like this.
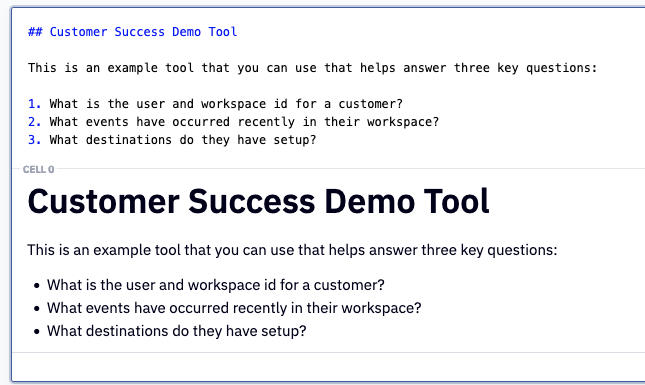
First, we'll add some Markdown cells to give our users some context to what the app is about.
Next, we'll just add the cells we care about to the app and remove the ones we don't want our users to see. This is as easy as dragging cells from the outline view into the app, or clicking the remove from app button to hide a cell.
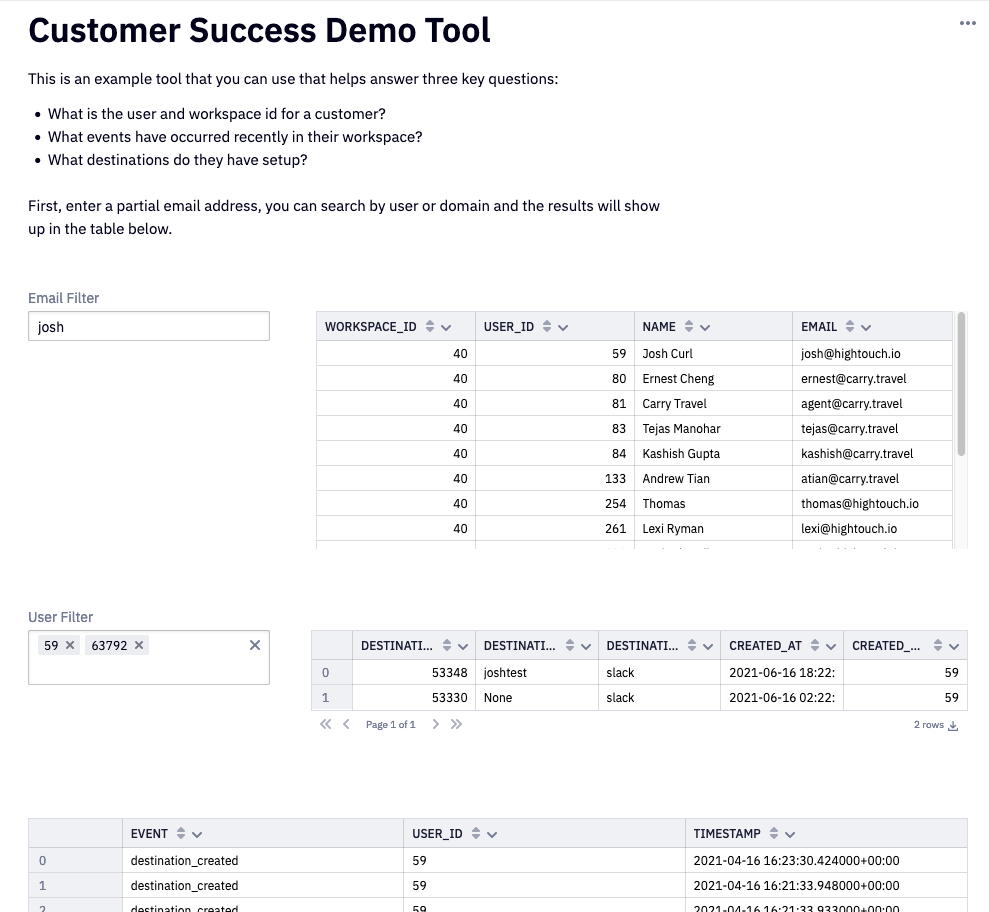
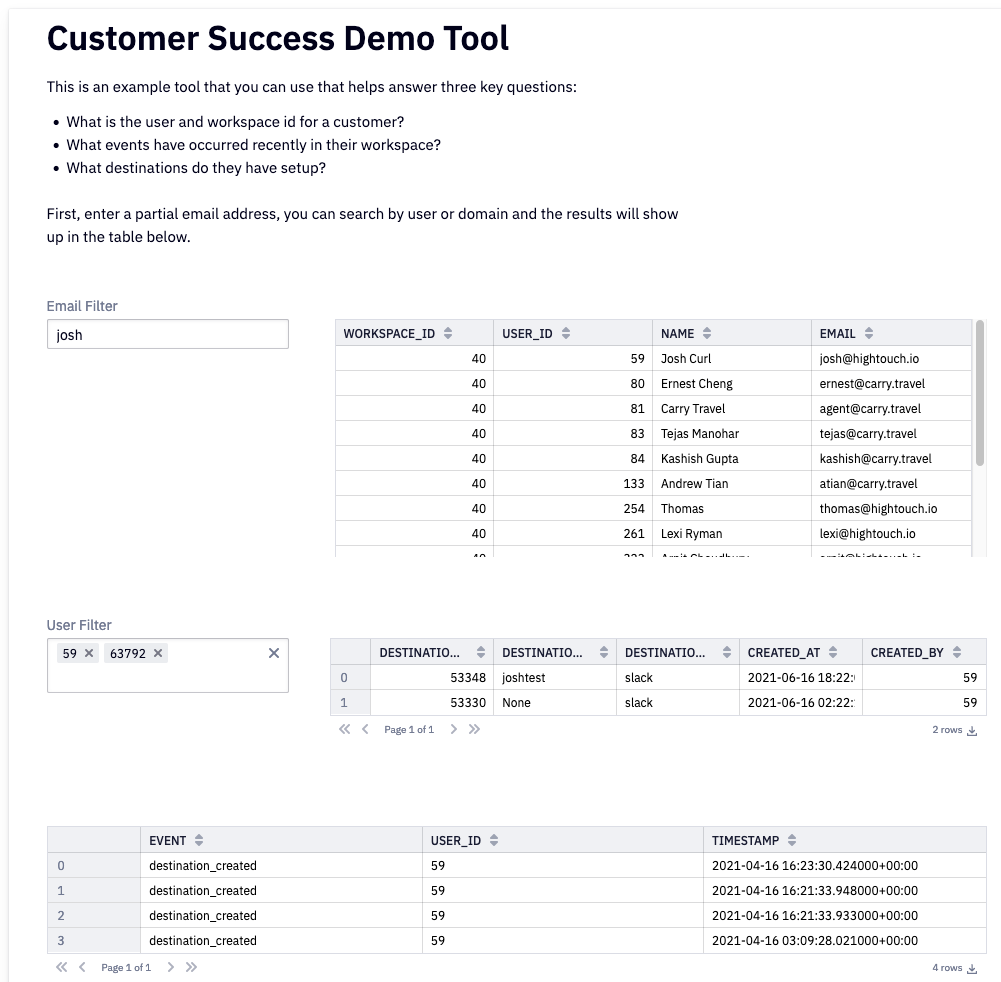
When that's all set and done, we'll have an app that looks like the one below. This could still be improved with a bit more thoughtful design, but it should be good enough to get in front of our users for feedback.
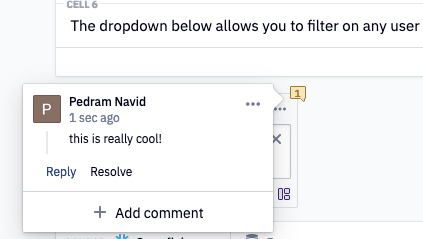
The last step is to click Publish to deploy our app for our colleagues, or use the Share button if we want to collaborate on the design together. Here, we'll use Share and send it to our pretend colleagues for pretend review, where we can leave comments directly on cells or even change the phrasing of our instructions as needed.
Once the app is fully published, we can view a live version of the app at any time. Before publishing, Hex will run your entire project as a fresh kernel, so that no weird state-errors crop up. This has helped me a few times when I've accidentally changed a cell without refreshing it, for example.
When we're all done, the Live Version of the app will look something like this:
Final Thoughts
I hope this was a useful walk through of what's possible with Hex. What I especially love about Hex and other tools like Hightouch is how they make it easy to activate data in your data warehouse. As data people, we spend a lot of time building models, cleaning data, testing our pipelines but too often the data ends up sitting there unused after serving some small one-time utility.
With the emergence of new ways of activating this data, I'm hopeful that we'll see a second-wave of data warehouse use cases that go beyond simple reporting and dashboards and into more use-case focused applications that can help teams company-wide.
If you'd like to try out Hex, visit their website to get access, and if you'd like to try Hightouch, you can sign up for free, no credit card required.